
Week ending 13-9-21 farm notes:
FARM PERFORMANCE
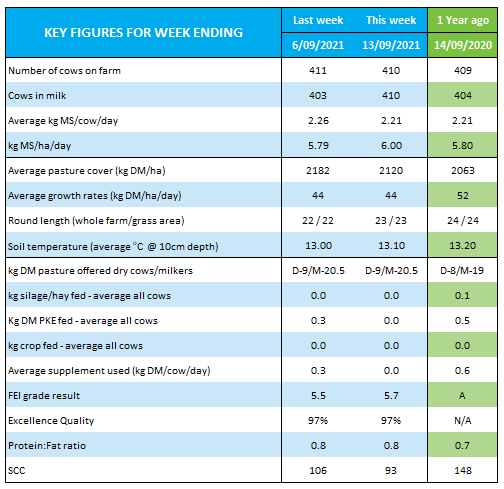
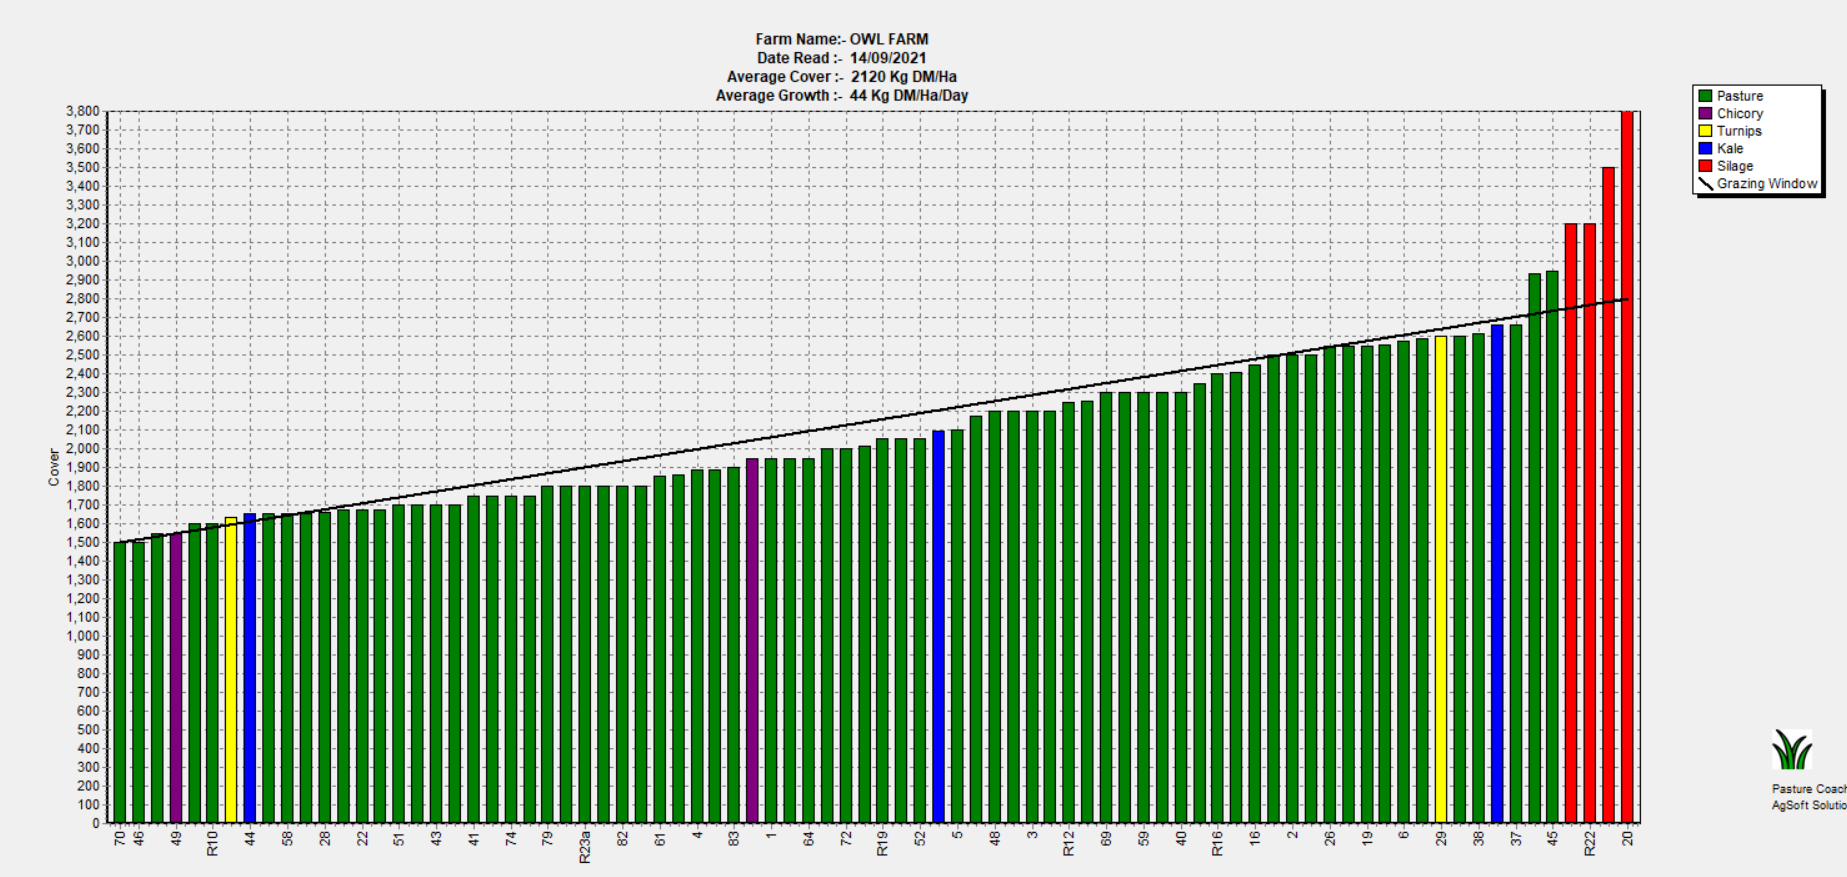
A static pasture growth rate of 44kgDM/ha/day resulted in a drop of APC to 2120 kgDM/ha. Current demand on pasture alone is 58kgDM/day. We have 2 paddocks left that meet our pre-graze target of 2780-2880 kgDM/ha. Calculated as 2.84 cows/ha x 20.5 kgDM/cow intake x 22 day rotation + 1500-1600kgDM/ha residual = 2780-2880kgDM/ha pre graze target.
Our next longest paddocks are 2600kgDM/ha. Options include do nothing and reduce intake while cows continue to mobilise BCS, offer more area per day and speed up the round, reduce demand through early culls, or use supplements to fill the gap.
We have 11ha allocated for cropping due to be sprayed out on Sunday which will increase our stocking rate to 3.08 cows/ha. We have 3 paddocks of annuals that are over 3200kgDM/ha that will be ensiled after spraying rather than pushing the cows to graze them. This will ensure that we get a cleaner paddock prior to sowing in the hope that it will reduce the slug pressure that we face for early crop survival.
With cows at peak production and mating due to start next Wednesday we made the decision to offer 2-3kgDM PK/cow depending on paddock size and while maintaining residuals. This will be reassessed after next week’s farm walk.
We do not want to go any faster as we are currently grazing the paddocks at 2.5 leaf stage and by going into these paddocks earlier we are trading of potential growth. We aim to generate around 55ha of grass silage through the spring at Owl Farm so need to manage pasture to maximise yield and quality. We have applied an average of 46kgN/ha over the last 6 weeks over 2 applications so there are only a few paddocks still to get there second application of N. We then move into strategic use of N based on soil test results to support silage making.
ANIMAL WELL-BEING
Calving finished last week and mating starts next week on Wednesday 22nd. We will be using pre-mating heats along with calving date, BCS, general health to determine alongside our vets which cows will benefit from CIDR use.
Bloat oil started through the dosatron this week. As this is 2 weeks later than we would normally start we are also manually adding bloat oil to the troughs until the dostaron has caught up. We continue to add MgCl to the dosatron and dust with MgO.
Calves are now on a 60/40 mix of milk replacer.
BUSINESS HEALTH
Nothing to report this week.
ENVIRONMENT
We have engaged the services of Wildlands to develop an integrated planting and management plan (IPMP) for Owl Farm. This can be viewed at https://www.owlfarm.nz/environment/farm-environment-plan
The objectives of the IPMP are to:
Prepare an integrated planting plan to guide the management of additional planting areas and previously planted areas within Owl Farm.
The IPMP will include planting for biodiversity, aesthetic, and shade/shelter outcomes.
Include site preparation, fencing, maintenance and monitoring requirements of planted areas.
Include planting schedules of appropriate species for each planting area.
Include a planting and management timeline and a calendar of activities for public events and student engagement.
Incorporate plants grown by students through the Trees for Survival programme and other farm education objectives.
Consider and be consistent with farm operations, the cycleway project, Waikato River restoration and any other farm or adjacent projects. Implementation of this IPMP will protect and enhance ecological features of the farm and help guide future planting and subsequent management. With approximate cost per planting area we are able to include in our budget cycle the cost of plants and have data available for applying for funding.
QUALITY WORKPLACE
Setting up for our AI technician who will be visiting multiple farms has involved QR code for scanning at the shed, boot wash and masks for workspaces safety.
COMMUNITY
Join us tomorrow via Facebook Live or our zoom catchup https://us02web.zoom.us/j/86273812669
to hear our Focus Day 20/21 wagon wheel results. Great chance to get your questions answered about the KPIs we are measuring our performance against.
PLANNING FOR THE MONTH AHEAD:
Cheers from Jo + Tom

| Milk Production - Week ending | 9/08/2021 | 16/08/2021 | 23/08/2021 | 30/08/2021 | 6/09/2021 | 13/09/2021 | Variance |
|---|---|---|---|---|---|---|---|
| Cow's in milk | 305 | 331 | 359 | 392 | 403 | 410 | +3 |
| Springer herd/dry cows | 113 | 82 | 52 | 19 | 7 | 0 | - |
| Number of cows in big herd | 250 | 187 | 220 | 220 | 235 | 248 | +8 |
| Number of cows in small herd | 0 | 108 | 120 | 130 | 151 | 151 | -6 |
| Number of cows in colostrum herd | 50 | 29 | 19 | 26 | 15 | 7 | +7 |
| Number of Cows in the Treatment/Sick herd | 0 | 0 | 0 | 4 | 4 | 4 | -3 |
| KgMS/cow/day (cows in the vat only) | 2.10 | 2.15 | 2.06 | 2.26 | 2.26 | 2.21 | +.51 |
| KgMS/cow YTD | 26.00 | 36.00 | 47.00 | 60.00 | 75.00 | 90.00 | -135 |
| Milk production for week ending (kgMS) | 4075.00 | 4142.00 | 4492.00 | 5365.00 | 5838.00 | 6044.00 | +2589 |
| Total milk production - YTD (kgMS) | 10453.00 | 14595.00 | 19087.00 | 24452.00 | 30290.00 | 36334.00 | -54857 |
| Milk production per ha (kgMS/ha/day) | 3.60 | 4.10 | 4.50 | 5.30 | 5.80 | 6.00 | +1.2 |
| Total milk production per ha - YTD (kgMS/ha/YTD) | 73.00 | 101.00 | 133.00 | 170.00 | 210.00 | 252.00 | -381 |
| Protein/Fat ratio | 0.78 | 0.79 | 0.78 | 0.75 | 0.75 | 0.78 | +.01 |
| Bulk Milk SCC (SCC x 1000) | 102 | 88 | 102 | 109 | 106 | 93 | +4 |
| Animal Health - Week ending | 9/08/2021 | 16/08/2021 | 23/08/2021 | 30/08/2021 | 6/09/2021 | 13/09/2021 | Variance |
|---|---|---|---|---|---|---|---|
| BCS (average whole herd) | 5.00 | 5.00 | 4.80 | 4.80 | 4.80 | 4.80 | +.3 |
| BCS (average heifers) | 5.30 | 5.30 | 5.00 | 4.80 | 4.90 | 4.90 | +.3 |
| Treatment/sick herd | 0 | 0 | 0 | 4 | 4 | 4 | -3 |
| Lame cows - new cases | 2 | 0 | 0 | 1 | 3 | 4 | +2 |
| Lame cows - YTD | 4 | 4 | 4 | 5 | 8 | 12 | -40 |
| Mastitis - new cases | 0 | 0 | 0 | 2 | 3 | 0 | - |
| Mastitis - YTD | 6 | 6 | 6 | 8 | 11 | 11 | -5 |
| Number of cows on penicillin | 0 | 0 | 0 | 4 | 4 | 0 | - |
| Number of cows on penicillin YTD | 11 | 11 | 11 | 15 | 19 | 19 | -10 |
| Culls - new cases | 0 | 5 | 2 | 0 | 0 | 0 | - |
| Culls - YTD | 0 | 5 | 7 | 7 | 7 | 7 | -1 |
| Deaths - new cases | 0 | 0 | 0 | 0 | 0 | 0 | - |
| Deaths - YTD | 0 | 0 | 0 | 0 | 0 | 0 | -2 |
| Pasture Production - Week ending | 9/08/2021 | 16/08/2021 | 23/08/2021 | 30/08/2021 | 6/09/2021 | 13/09/2021 | Variance |
|---|---|---|---|---|---|---|---|
| Average pasture cover (kgDM/ha) | 2161 | 2115 | 2151 | 2204 | 2182 | 2120 | -68 |
| Average pasture growth rates (kgDM/day) | 36 | 32 | 38 | 50 | 44 | 44 | -29 |
| Lowest post graze residual (kgDM/ha) | 1500 | 1500 | 1536 | 1450 | 1450 | 1500 | - |
| Highest pre graze cover (kgDM/ha) | 3850 | 3850 | 2800 | 2900 | 3000 | 2900 | -250 |
| Average area grazed/day for milkers (ha) | 2.75 | 3.20 | 3.78 | 4.57 | 6.60 | 6.30 | +.4 |
| Round length | 52 | 45 | 38 | 32 | 22 | 23 | +1 |
| Total Biomass Measured (kgDM) ) |
| Supplementary Use - Week ending | 9/08/2021 | 16/08/2021 | 23/08/2021 | 30/08/2021 | 6/09/2021 | 13/09/2021 | Variance |
|---|---|---|---|---|---|---|---|
| Average PKE (kg/cow/day) | 2.00 | 2.00 | 2.00 | 3.00 | 0.30 | 0.00 | - |
| PKE YTD | 39.60 | 45.40 | 51.20 | 59.80 | 60.50 | 60.50 | -15.8 |
| Average maize (kg/cow/day) | 0.00 | 0.00 | 0.00 | 0.00 | 0.00 | 0.00 | - |
| Maize YTD | 0.00 | 0.00 | 0.00 | 0.00 | 0.00 | 0.00 | - |
| Average silage (kg/cow/day) | 0.00 | 2.00 | 2.00 | 3.00 | 1.50 | 0.00 | - |
| Silage usage YTD | 9.10 | 14.90 | 20.60 | 29.20 | 34.20 | 34.20 | - |
| Silage Harvested Tonnes (DM) | 0.00 | 0.00 | 0.00 | 0.00 | 0.00 | 0.00 | -15 |
| Total Supplement Feed (per cow kgDM) | 14.00 | 31.50 | 31.50 | 45.50 | 12.30 | 0.00 | - |
| Total Supplement YTD (Tonnes) | 53.60 | 66.70 | 79.70 | 98.40 | 104.10 | 104.10 | -15.8 |
| Nitrogen and Gibberellic Acid - Week ending | 9/08/2021 | 16/08/2021 | 23/08/2021 | 30/08/2021 | 6/09/2021 | 13/09/2021 | Variance |
|---|---|---|---|---|---|---|---|
| kgN applied per ha/% of farm | 15.30 KgN/ 59.00 % | 30.00 KgN/ 33.30 % | 0.00 KgN/ 0.00 % | 23.50 KgN/ 31.90 % | 28.80 KgN/ 27.80 % | 24.80 KgN/ 45.10 % | 45.10 % |
| kgN applied YTD (average kgN/ha) | 9.00 | 19.00 | 19.00 | 26.50 | 34.50 | 45.70 | -34.1 |
| GA applied (20gm/ha) | 0.00 | 0.00 | 0.00 | 0.00 | 0.00 | 0.00 | - |
| Effluent applied | |||||||
| Effluent Applied y/n | N | Y | Y | N | N | N | - |
| Paddocks effluent applied | 0 | 4 | 5 | 0 | 0 | 0 | -5 |
| Application Depth (mm) | 0.00 | 12.00 | 18.00 | 0.00 | 0.00 | 0.00 | - |
| Climate - Week ending | 9/08/2021 | 16/08/2021 | 23/08/2021 | 30/08/2021 | 6/09/2021 | 13/09/2021 | Variance |
|---|---|---|---|---|---|---|---|
| Temperature (ave. °C) | 10.50 | 9.74 | 10.30 | 12.00 | 12.50 | 11.50 | -5.52 |
| Rainfall | 40.00 | 13.60 | 20.40 | 46.40 | 1.60 | 36.80 | +32.8 |
| Rainfall Season-to-Date | 255.00 | 268.60 | 296.90 | 343.30 | 344.90 | 381.70 | -255.2 |
| Soil temperature (ave. °C at 10cm depth) | 12.20 | 9.38 | 11.40 | 14.00 | 13.00 | 13.10 | -6.9 |
| Soil Moisture(% at 10cm depth) | 34.30 | 95.26 | 33.50 | 34.00 | 33.00 | 33.60 | +.9 |
 Home
Home  OwlFarm Home
 News
News  Images
 Videos
 Milk Production
 Animal Health
 Pasture Production
 Supplementary Use
 Nitrogen & Gibberellic Acid Use
 Climate
 Ops Manual
  Financials
  Health