
Week ending 20-9-21 farm notes:
FARM PERFORMANCE
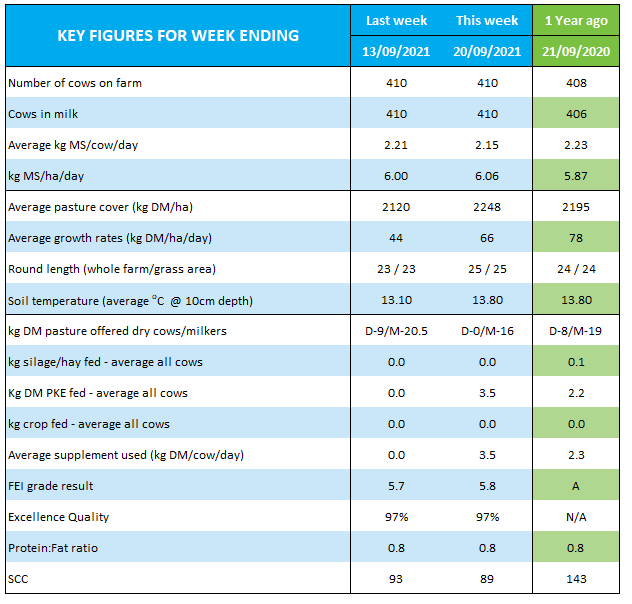
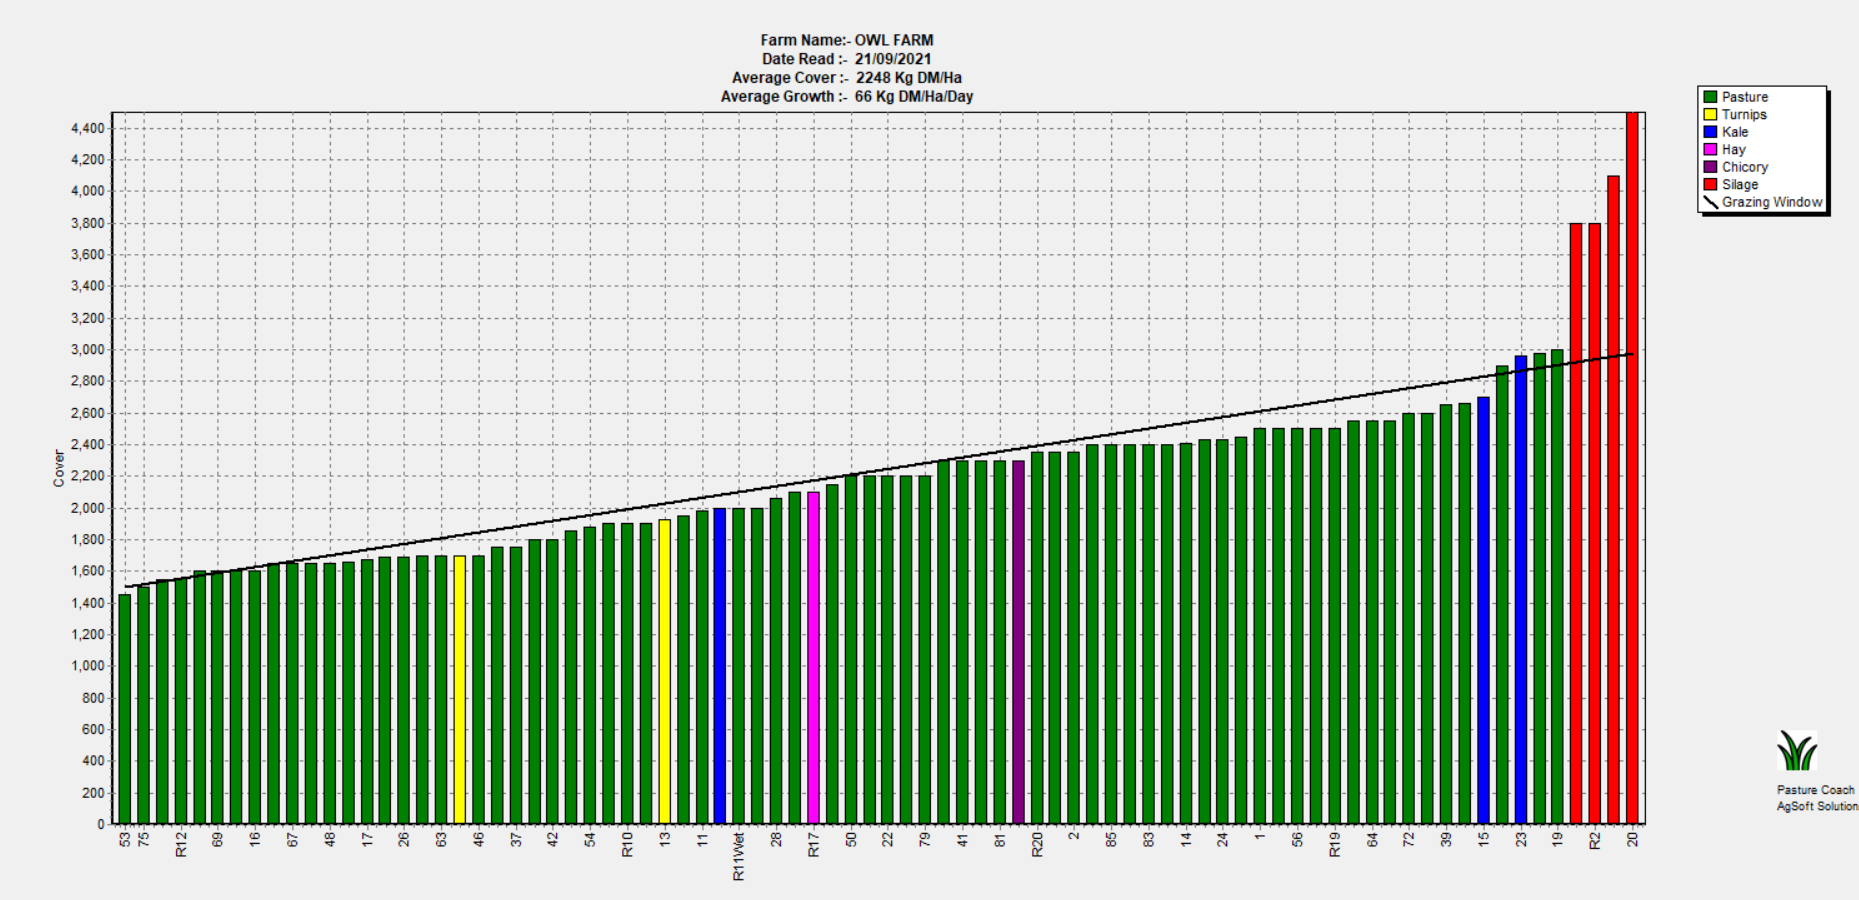
After 2 wet weeks and delayed growth rates we were pleased to see that APC lifted to 2248 kgDM/ha with a growth rate of 66 kgDM/ha/day. Our APC includes 8.2ha of annuals that are over 3000kgDM/ha that are due to be ensiled before going into crop. Removing these silage paddocks to show the grazeable pasture on farm drops our APC to 2128 kgDM/ha.
On Sunday we roundup sprayed 12ha of the farm plus the support area for calves on Chicory. Non annual crop paddocks will be grazed by the cows before direct drilling. The aim is to clean these paddocks out before drilling to reduce slug pressure on germinating seedlings. Planting date for all crops is planned for 1st October.
With lower pre-graze covers this week we filled the gap with 3.5kgDM PK. This lifted our FEI from 4.8 with no PK to 6 (which is still well within the threshold of 9). Total feed offered dropped to 19.5kgDM/cow/day but residuals and cow behaviour showed us that cows were content. Cows have started leaving the PK preferring pastures and as our pre-graze covers increase to 2700-2900 kgDM/ha we are reducing the PK offered down to 1kgDM/cow/day for this week. Still targeting minimum 20 kgDM/cow/day offered. We have enough PK in our bin but have been warned of up to 9 day waits on PK deliveries. Our cows require intakes of 18.7 kgDM high quality feed to meet energy output and more to be gaining BCS.
ANIMAL WELL-BEING
We have had 69 mm of rain so far in September more than all of September last year. September is the highest rainfall month of the year with average rainfall of 131mm. This has caused a spate of lameness with 10 cows drafted out to rest or treat this week – bringing our season to date total to 26 cows.
We had 130 non-cyclers on 15th Sept. Out of these 52 were late calving cows (calved less than 42 days)
As at the 22nd September we still have 38 cows on our watch list still to cycle that have calved more than 42 days. CIDRs are due to go in 23rd September on a select group of these cows.
Heifers have been synchronised and mated on the 20th and 21st for the two mobs out grazing. Cows have all had fresh tailpaint with green indicating cycled cow, blue indicating calved less than 42 days from PSM and yellow a non-cycling cow. Cows start mating 22nd Sept which is a 1st July PSC.
Cows are still receiving MgCl (5g Mag/cow), Zinc and bloat oil via the dosatron and paddocks get dusted with MgO (13-15g Mag/cow) ahead of the cows.
Colostrum milk has all been used and replacement heifers are on 80% formula/20% vat milk mix. They are being rotated around the farm 2 days per paddock and the second mob of calves have just ventured outside.
BUSINESS HEALTH
After the first 3 months of the season we have spent $210,464 and produced 25,252 kgMS.
LIC dividend received earlier than budget, and increases in payout since budget was approved in March, show an increase of $68,023 income season to date. Timing of expenses including purchasing all Mg at the start of the season (which provided very valuable due to shipping delays), fertiliser timing relative to budget and increase in product price, and the decision to use milk replacement powder instead of milk from the vat have all increased expenses season to date by $30,093. Surplus is tracking $36,501 ahead of budget season to date. Our full actual to budget cashflow can be found https://www.owlfarm.nz/financials/farmbudgets
ENVIRONMENT
Farm Insights report from Fonterra shows Purchased N surplus reduced to 110kgN/ha compared to 133 kgN/ha in 2019/20 and 169 kgN/ha in 2018/19.
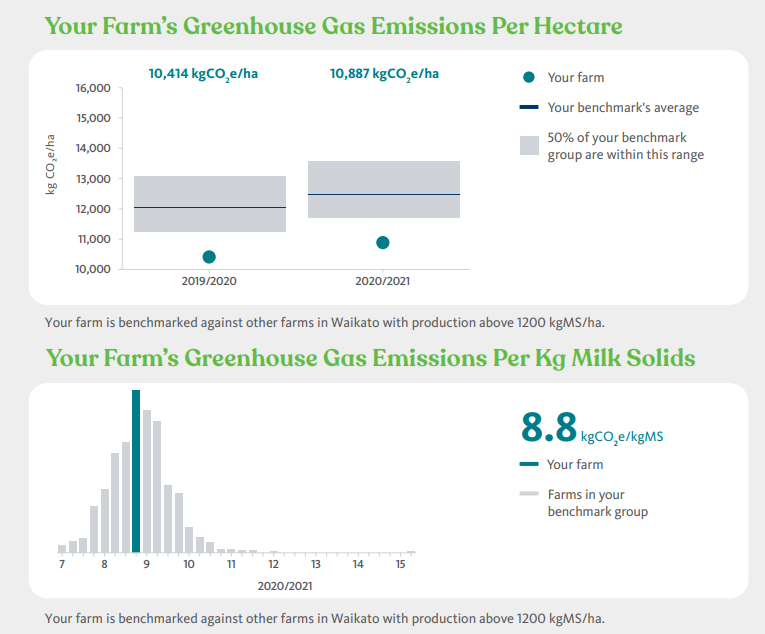
The GHG emissions showed that the BM group in the Waikato along with us increased in 2020/21 compared with 2019/20 as a result of a good production season. We are still tracking lower per hectare than other farms producing more than 1200kgMS/ha.
QUALITY WORKPLACE
Nothing to report
COMMUNITY
If you missed last week’s Farm Focus Day presentation you can view it via https://youtu.be/ItmEsZSsoO8.
Wednesday weekly zoom catchup is on preparing for summer crops and can be found on FB.
PLANNING FOR THE MONTH AHEAD:
Cheers from Jo + Tom

| Milk Production - Week ending | 16/08/2021 | 23/08/2021 | 30/08/2021 | 6/09/2021 | 13/09/2021 | 20/09/2021 | Variance |
|---|---|---|---|---|---|---|---|
| Cow's in milk | 331 | 359 | 392 | 403 | 410 | 410 | +3 |
| Springer herd/dry cows | 82 | 52 | 19 | 7 | 0 | 0 | - |
| Number of cows in big herd | 187 | 220 | 220 | 235 | 248 | 245 | +5 |
| Number of cows in small herd | 108 | 120 | 130 | 151 | 151 | 151 | -6 |
| Number of cows in colostrum herd | 29 | 19 | 26 | 15 | 7 | 0 | - |
| Number of Cows in the Treatment/Sick herd | 0 | 0 | 4 | 4 | 4 | 14 | +7 |
| KgMS/cow/day (cows in the vat only) | 2.15 | 2.06 | 2.26 | 2.26 | 2.21 | 2.15 | +.45 |
| KgMS/cow YTD | 36.00 | 47.00 | 60.00 | 75.00 | 90.00 | 105.00 | -120 |
| Milk production for week ending (kgMS) | 4142.00 | 4492.00 | 5365.00 | 5838.00 | 6044.00 | 6097.00 | +2642 |
| Total milk production - YTD (kgMS) | 14595.00 | 19087.00 | 24452.00 | 30290.00 | 36334.00 | 42431.00 | -48760 |
| Milk production per ha (kgMS/ha/day) | 4.10 | 4.50 | 5.30 | 5.80 | 6.00 | 6.10 | +1.3 |
| Total milk production per ha - YTD (kgMS/ha/YTD) | 101.00 | 133.00 | 170.00 | 210.00 | 252.00 | 295.00 | -338 |
| Protein/Fat ratio | 0.79 | 0.78 | 0.75 | 0.75 | 0.78 | 0.78 | +.01 |
| Bulk Milk SCC (SCC x 1000) | 88 | 102 | 109 | 106 | 93 | 89 | - |
| Animal Health - Week ending | 16/08/2021 | 23/08/2021 | 30/08/2021 | 6/09/2021 | 13/09/2021 | 20/09/2021 | Variance |
|---|---|---|---|---|---|---|---|
| BCS (average whole herd) | 5.00 | 4.80 | 4.80 | 4.80 | 4.80 | 4.80 | +.3 |
| BCS (average heifers) | 5.30 | 5.00 | 4.80 | 4.90 | 4.90 | 4.90 | +.3 |
| Treatment/sick herd | 0 | 0 | 4 | 4 | 4 | 14 | 7 |
| Lame cows - new cases | 0 | 0 | 1 | 3 | 4 | 7 | +5 |
| Lame cows - YTD | 4 | 4 | 5 | 8 | 12 | 19 | -33 |
| Mastitis - new cases | 0 | 0 | 2 | 3 | 0 | 0 | - |
| Mastitis - YTD | 6 | 6 | 8 | 11 | 11 | 11 | -5 |
| Number of cows on penicillin | 0 | 0 | 4 | 4 | 0 | 0 | - |
| Number of cows on penicillin YTD | 11 | 11 | 15 | 19 | 19 | 19 | -10 |
| Culls - new cases | 5 | 2 | 0 | 0 | 0 | 0 | - |
| Culls - YTD | 5 | 7 | 7 | 7 | 7 | 7 | -1 |
| Deaths - new cases | 0 | 0 | 0 | 0 | 0 | 0 | - |
| Deaths - YTD | 0 | 0 | 0 | 0 | 0 | 0 | -2 |
| Pasture Production - Week ending | 16/08/2021 | 23/08/2021 | 30/08/2021 | 6/09/2021 | 13/09/2021 | 20/09/2021 | Variance |
|---|---|---|---|---|---|---|---|
| Average pasture cover (kgDM/ha) | 2115 | 2151 | 2204 | 2182 | 2120 | 2248 | +60 |
| Average pasture growth rates (kgDM/day) | 32 | 38 | 50 | 44 | 44 | 66 | -7 |
| Lowest post graze residual (kgDM/ha) | 1500 | 1536 | 1450 | 1450 | 1500 | 1450 | -50 |
| Highest pre graze cover (kgDM/ha) | 3850 | 2800 | 2900 | 3000 | 2900 | 2650 | -500 |
| Average area grazed/day for milkers (ha) | 3.20 | 3.78 | 4.57 | 6.60 | 6.30 | 5.70 | -.2 |
| Round length | 45 | 38 | 32 | 22 | 23 | 25 | +3 |
| Total Biomass Measured (kgDM) ) |
| Supplementary Use - Week ending | 16/08/2021 | 23/08/2021 | 30/08/2021 | 6/09/2021 | 13/09/2021 | 20/09/2021 | Variance |
|---|---|---|---|---|---|---|---|
| Average PKE (kg/cow/day) | 2.00 | 2.00 | 3.00 | 0.30 | 0.00 | 3.50 | +3.5 |
| PKE YTD | 45.40 | 51.20 | 59.80 | 60.50 | 60.50 | 70.60 | -5.7 |
| Average maize (kg/cow/day) | 0.00 | 0.00 | 0.00 | 0.00 | 0.00 | 0.00 | - |
| Maize YTD | 0.00 | 0.00 | 0.00 | 0.00 | 0.00 | 0.00 | - |
| Average silage (kg/cow/day) | 2.00 | 2.00 | 3.00 | 1.50 | 0.00 | 0.00 | - |
| Silage usage YTD | 14.90 | 20.60 | 29.20 | 34.20 | 34.20 | 34.20 | - |
| Silage Harvested Tonnes (DM) | 0.00 | 0.00 | 0.00 | 0.00 | 0.00 | 0.00 | -15 |
| Total Supplement Feed (per cow kgDM) | 31.50 | 31.50 | 45.50 | 12.30 | 0.00 | 24.50 | +24.5 |
| Total Supplement YTD (Tonnes) | 66.70 | 79.70 | 98.40 | 104.10 | 104.10 | 114.10 | -5.8 |
| Nitrogen and Gibberellic Acid - Week ending | 16/08/2021 | 23/08/2021 | 30/08/2021 | 6/09/2021 | 13/09/2021 | 20/09/2021 | Variance |
|---|---|---|---|---|---|---|---|
| kgN applied per ha/% of farm | 30.00 KgN/ 33.30 % | 0.00 KgN/ 0.00 % | 23.50 KgN/ 31.90 % | 28.80 KgN/ 27.80 % | 24.80 KgN/ 45.10 % | 0.00 KgN/ 0.00 % | 0.00 % |
| kgN applied YTD (average kgN/ha) | 19.00 | 19.00 | 26.50 | 34.50 | 45.70 | 45.70 | -34.1 |
| GA applied (20gm/ha) | 0.00 | 0.00 | 0.00 | 0.00 | 0.00 | 0.00 | - |
| Effluent applied | |||||||
| Effluent Applied y/n | Y | Y | N | N | N | N | - |
| Paddocks effluent applied | 4 | 5 | 0 | 0 | 0 | 0 | -5 |
| Application Depth (mm) | 12.00 | 18.00 | 0.00 | 0.00 | 0.00 | 0.00 | - |
| Climate - Week ending | 30/08/2021 | 6/09/2021 | 13/09/2021 | 16/09/2021 | 16/09/2021 | 20/09/2021 | Variance |
|---|---|---|---|---|---|---|---|
| Temperature (ave. °C) | 12.00 | 12.50 | 11.50 | 11.98 | 11.98 | 11.80 | -5.22 |
| Rainfall | 46.40 | 1.60 | 36.80 | 42.40 | 42.40 | 35.00 | +31 |
| Rainfall Season-to-Date | 343.30 | 344.90 | 381.70 | 424.10 | 466.50 | 416.70 | -220.2 |
| Soil temperature (ave. °C at 10cm depth) | 14.00 | 13.00 | 13.10 | 11.62 | 11.62 | 13.80 | -6.2 |
| Soil Moisture(% at 10cm depth) | 34.00 | 33.00 | 33.60 | 97.53 | 97.53 | 34.80 | +2.1 |
 Home
Home  OwlFarm Home
 News
News  Images
 Videos
 Milk Production
 Animal Health
 Pasture Production
 Supplementary Use
 Nitrogen & Gibberellic Acid Use
 Climate
 Ops Manual
  Financials
  Health