
Week ending 4-10-21 farm notes:
FARM PERFORMANCE
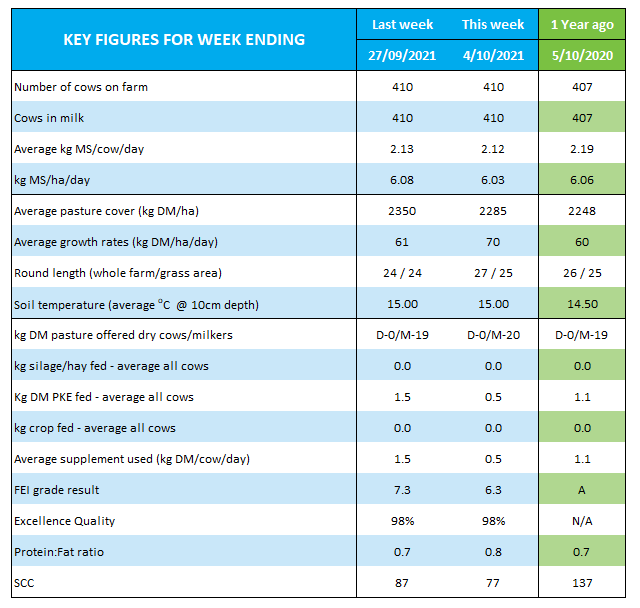
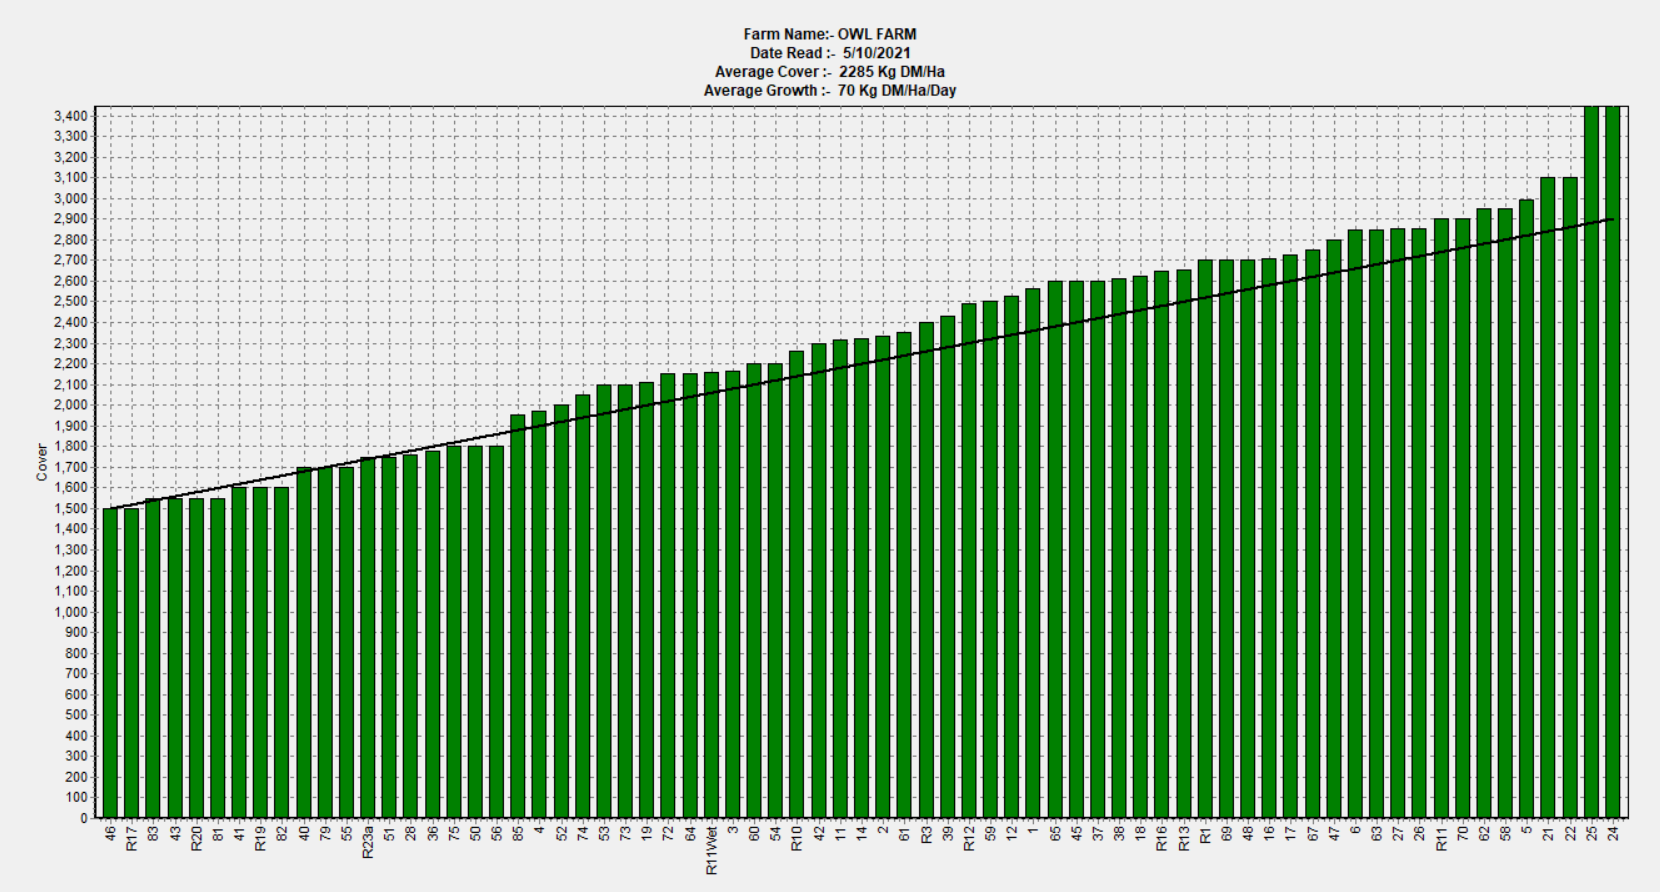
Average Pasture Cover reduced to 2285 kg DM/ha with the removal of 9.75 ha of silage from the farm. The grazeable area for the next 7 months is now 132 ha, pushing stocking rate up to 3.1 cows/ha. Daily demand, including the 5 yearlings and 100 calves in the paddocks, is now 65.5 kg DM/ha/day. Cows are being offered >20 kg DM/day aiming for a pre-graze cover of 2900 kg DM/ha. With so many cows bulling, (average of 23 a day) they are struggling to clean out paddocks, so we have been putting them back in before moving onto a fresh break. This has slowed the round down to 25 days.
With over 88 paddocks on the farm, ranging from 4.49 ha to 0.83 ha, collecting and processing weekly farmwalk data is essential to make timely decisions. We use small amounts of PK to support paddock allocation for the hospital mob and the young herd. We are looking forward to technology that will help us manage pastures more efficiently in 2022.
Using the DairyNZ calculation (in FarmFact 1-38), feed demand 65.5 kg DM/ha/day ÷ by PGR 70 kg DM/ha/day x grazeable area estimates we only need 123.5 ha to feed all the stock. So we have over 8 ha of surplus in our current wedge and aim to build that to 20 ha to make it worth ensiling pit silage instead of doing bales. The herd has been producing over 2 kg MS/cow/day for more than 9 weeks now, and SCC continues to hold below 100,000 which is approximately 40-60,000 lower than this time last season. We have had no new mastitis cows for 4 weeks.
We have purchased 100 t DM grass from Fonterra at 20c/kg DM + 16-18c/kg DM to ensile. This is made up of 40 t DM to replace PK to meet FEI targets, 40 t DM to cover runoff silage which is now growing chicory for calves, and 20 t DM for the calves at home.
We still budget to make another 157 t DM of silage and 5 ha of hay off the milking platform.
Pasture samples taken 29th September showed average ME of 11.94 MJME/kg DM, DM of 13.5%, Protein of 23.1% DM. While both the ME and DM have dropped from our September pasture samples the cows are content and milk production remains constant over 2.1 kg MS/cow/day.
Over the weekend we were grateful to have a team of contractors on farm, including Greg Muller from G&H Agri using his cross slot drill, Kaipaki Contracting, Finch Contracting, Wally Sinton Re-grass Contracting, and Malcolm from Spraylink. Big thanks to the tyre-throwing team of Kelli, Phoebe and Sophie who helped Tom and LaArni throw tyres into the night – they truly earned their pizza.
We now have in the ground 2 ha of Cleancrop Toto turnip and 2.8 ha of Cleancrop bulb turnip, 7.1 ha of Cleancrop kale and 7.1 ha of chicory (dairy support land).
The brassica seeds were treated with Ultrastrike for protection against insects and diseases. CropZeal DAP Boron Boost went down the spout @ 250kg/ha together with slugbait broadcast. Telar was sprayed immediately afterwards to provide effective weed control right from the start.
Mating continues to go well with 80% of all cows submitted in two weeks. This includes PG and CIDR cows.
ANIMAL WELL-BEING
Cases of lameness have eased off after the wet period with only one new case this week, bringing our total to 25 cows season to date or 6% of the herd.
We have 92 replacement heifers, 3 bulls for charity and 5 beefies now out on pasture. Calves are eating a blend of calf meal and PK to reduce the cost of calf feed and nearly all calves are on 100% milk replacer.
BUSINESS HEALTH
Nothing to report this week.
ENVIRONMENT
LaArni has started using a trough cover for the effluent paddocks to prevent effluent contaminating drinking troughs. 23 kg N/ha was applied to another 65 ha of the farm as part of our N strategy to produce grass silage to feed in the late summer and August period. We have used 56 kg N/ha season to date. This year we are recording via spreadsheet each paddock’s N application via fertiliser and effluent to keep a running total for reporting due 31 July 2022 to council. This information is also valuable for accurate Overseer data loading.
QUALITY WORKPLACE
Cropping and silage-making throw a spanner in the works for our average hours worked this week, with the team completing 220 hours between them. The bulk of it fell on the senior team members. We are grateful for the flexibility needed to completed the work with delays in weather and contractor schedules changing work routines. Taking afternoons off during the week to catch up on rest, house and family commitments is essential to keep balance.
COMMUNITY
Nothing to report this week.
PLANNING FOR THE MONTH AHEAD:
Cheers from Jo + Tom

| Milk Production - Week ending | 30/08/2021 | 6/09/2021 | 13/09/2021 | 20/09/2021 | 27/09/2021 | 4/10/2021 | Variance |
|---|---|---|---|---|---|---|---|
| Cow's in milk | 392 | 403 | 410 | 410 | 410 | 410 | +3 |
| Springer herd/dry cows | 19 | 7 | 0 | 0 | 0 | 0 | - |
| Number of cows in big herd | 220 | 235 | 248 | 245 | 245 | 245 | +5 |
| Number of cows in small herd | 130 | 151 | 151 | 151 | 151 | 151 | -6 |
| Number of cows in colostrum herd | 26 | 15 | 7 | 0 | 0 | 0 | - |
| Number of Cows in the Treatment/Sick herd | 4 | 4 | 4 | 14 | 14 | 14 | +7 |
| KgMS/cow/day (cows in the vat only) | 2.26 | 2.26 | 2.21 | 2.15 | 2.13 | 2.12 | +.42 |
| KgMS/cow YTD | 60.00 | 75.00 | 90.00 | 105.00 | 120.00 | 135.00 | -90 |
| Milk production for week ending (kgMS) | 5365.00 | 5838.00 | 6044.00 | 6097.00 | 6118.00 | 6079.00 | +2624 |
| Total milk production - YTD (kgMS) | 24452.00 | 30290.00 | 36334.00 | 42431.00 | 48549.00 | 54628.00 | -36563 |
| Milk production per ha (kgMS/ha/day) | 5.30 | 5.80 | 6.00 | 6.10 | 6.10 | 6.00 | +1.2 |
| Total milk production per ha - YTD (kgMS/ha/YTD) | 170.00 | 210.00 | 252.00 | 295.00 | 337.00 | 379.00 | -254 |
| Protein/Fat ratio | 0.75 | 0.75 | 0.78 | 0.78 | 0.73 | 0.78 | +.01 |
| Bulk Milk SCC (SCC x 1000) | 109 | 106 | 93 | 89 | 87 | 77 | -12 |
| Animal Health - Week ending | 30/08/2021 | 6/09/2021 | 13/09/2021 | 20/09/2021 | 27/09/2021 | 4/10/2021 | Variance |
|---|---|---|---|---|---|---|---|
| BCS (average whole herd) | 4.80 | 4.80 | 4.80 | 4.80 | 4.60 | 4.60 | +.1 |
| BCS (average heifers) | 4.80 | 4.90 | 4.90 | 4.90 | 4.80 | 4.80 | +.2 |
| Treatment/sick herd | 4 | 4 | 4 | 14 | 14 | 14 | 7 |
| Lame cows - new cases | 1 | 3 | 4 | 7 | 5 | 1 | -1 |
| Lame cows - YTD | 5 | 8 | 12 | 19 | 24 | 25 | -27 |
| Mastitis - new cases | 2 | 3 | 0 | 0 | 0 | 0 | - |
| Mastitis - YTD | 8 | 11 | 11 | 11 | 11 | 11 | -5 |
| Number of cows on penicillin | 4 | 4 | 0 | 0 | 0 | 1 | +1 |
| Number of cows on penicillin YTD | 15 | 19 | 19 | 19 | 19 | 20 | -9 |
| Culls - new cases | 0 | 0 | 0 | 0 | 0 | 0 | - |
| Culls - YTD | 7 | 7 | 7 | 7 | 7 | 7 | -1 |
| Deaths - new cases | 0 | 0 | 0 | 0 | 0 | 0 | - |
| Deaths - YTD | 0 | 0 | 0 | 0 | 0 | 0 | -2 |
| Pasture Production - Week ending | 30/08/2021 | 6/09/2021 | 13/09/2021 | 20/09/2021 | 27/09/2021 | 4/10/2021 | Variance |
|---|---|---|---|---|---|---|---|
| Average pasture cover (kgDM/ha) | 2204 | 2182 | 2120 | 2248 | 2350 | 2285 | +97 |
| Average pasture growth rates (kgDM/day) | 50 | 44 | 44 | 66 | 61 | 70 | -3 |
| Lowest post graze residual (kgDM/ha) | 1450 | 1450 | 1500 | 1450 | 1500 | 1500 | - |
| Highest pre graze cover (kgDM/ha) | 2900 | 3000 | 2900 | 2650 | 3000 | 3000 | -150 |
| Average area grazed/day for milkers (ha) | 4.57 | 6.60 | 6.30 | 5.70 | 5.90 | 5.30 | -.6 |
| Round length | 32 | 22 | 23 | 25 | 24 | 25 | +3 |
| Total Biomass Measured (kgDM) ) |
| Supplementary Use - Week ending | 30/08/2021 | 6/09/2021 | 13/09/2021 | 20/09/2021 | 27/09/2021 | 4/10/2021 | Variance |
|---|---|---|---|---|---|---|---|
| Average PKE (kg/cow/day) | 3.00 | 0.30 | 0.00 | 3.50 | 1.50 | 0.50 | +.5 |
| PKE YTD | 59.80 | 60.50 | 60.50 | 70.60 | 74.90 | 76.30 | - |
| Average maize (kg/cow/day) | 0.00 | 0.00 | 0.00 | 0.00 | 0.00 | 0.00 | - |
| Maize YTD | 0.00 | 0.00 | 0.00 | 0.00 | 0.00 | 0.00 | - |
| Average silage (kg/cow/day) | 3.00 | 1.50 | 0.00 | 0.00 | 0.00 | 0.00 | - |
| Silage usage YTD | 29.20 | 34.20 | 34.20 | 34.20 | 34.20 | 34.20 | - |
| Silage Harvested Tonnes (DM) | 0.00 | 0.00 | 0.00 | 0.00 | 0.00 | 23.00 | +8 |
| Total Supplement Feed (per cow kgDM) | 45.50 | 12.30 | 0.00 | 24.50 | 10.50 | 3.50 | +3.5 |
| Total Supplement YTD (Tonnes) | 98.40 | 104.10 | 104.10 | 114.10 | 118.40 | 119.90 | - |
| Nitrogen and Gibberellic Acid - Week ending | 30/08/2021 | 6/09/2021 | 13/09/2021 | 20/09/2021 | 27/09/2021 | 4/10/2021 | Variance |
|---|---|---|---|---|---|---|---|
| kgN applied per ha/% of farm | 23.50 KgN/ 31.90 % | 28.80 KgN/ 27.80 % | 24.80 KgN/ 45.10 % | 0.00 KgN/ 0.00 % | 0.00 KgN/ 0.00 % | 23.00 KgN/ 45.10 % | 45.10 % |
| kgN applied YTD (average kgN/ha) | 26.50 | 34.50 | 45.70 | 45.70 | 45.70 | 56.10 | -23.7 |
| GA applied (20gm/ha) | 0.00 | 0.00 | 0.00 | 0.00 | 0.00 | 0.00 | - |
| Effluent applied | |||||||
| Effluent Applied y/n | N | N | N | N | Y | N | - |
| Paddocks effluent applied | 0 | 0 | 0 | 0 | 4 | 0 | -5 |
| Application Depth (mm) | 0.00 | 0.00 | 0.00 | 0.00 | 18.00 | 0.00 | - |
| Climate - Week ending | 13/09/2021 | 16/09/2021 | 16/09/2021 | 20/09/2021 | 27/09/2021 | 4/10/2021 | Variance |
|---|---|---|---|---|---|---|---|
| Temperature (ave. °C) | 11.50 | 11.98 | 11.98 | 11.80 | 12.70 | 13.00 | -4.02 |
| Rainfall | 36.80 | 42.40 | 42.40 | 35.00 | 62.00 | 12.50 | +8.5 |
| Rainfall Season-to-Date | 381.70 | 424.10 | 466.50 | 416.70 | 478.70 | 491.20 | -145.7 |
| Soil temperature (ave. °C at 10cm depth) | 13.10 | 11.62 | 11.62 | 13.80 | 15.00 | 15.00 | -5 |
| Soil Moisture(% at 10cm depth) | 33.60 | 97.53 | 97.53 | 34.80 | 33.70 | 33.40 | +.7 |
 Home
Home  OwlFarm Home
 News
News  Images
 Videos
 Milk Production
 Animal Health
 Pasture Production
 Supplementary Use
 Nitrogen & Gibberellic Acid Use
 Climate
 Ops Manual
  Financials
  Health