
Week ending 15-11-21 farm notes:
FARM PERFORMANCE
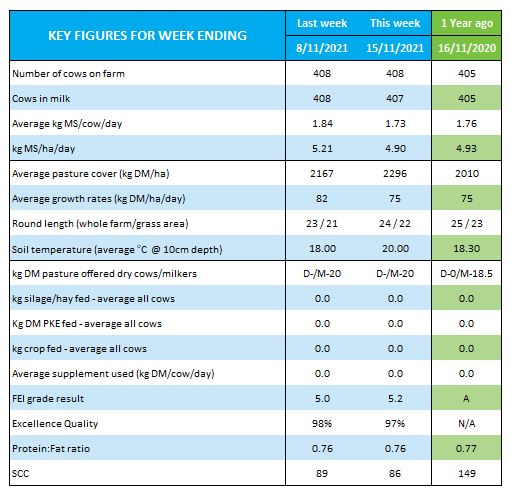
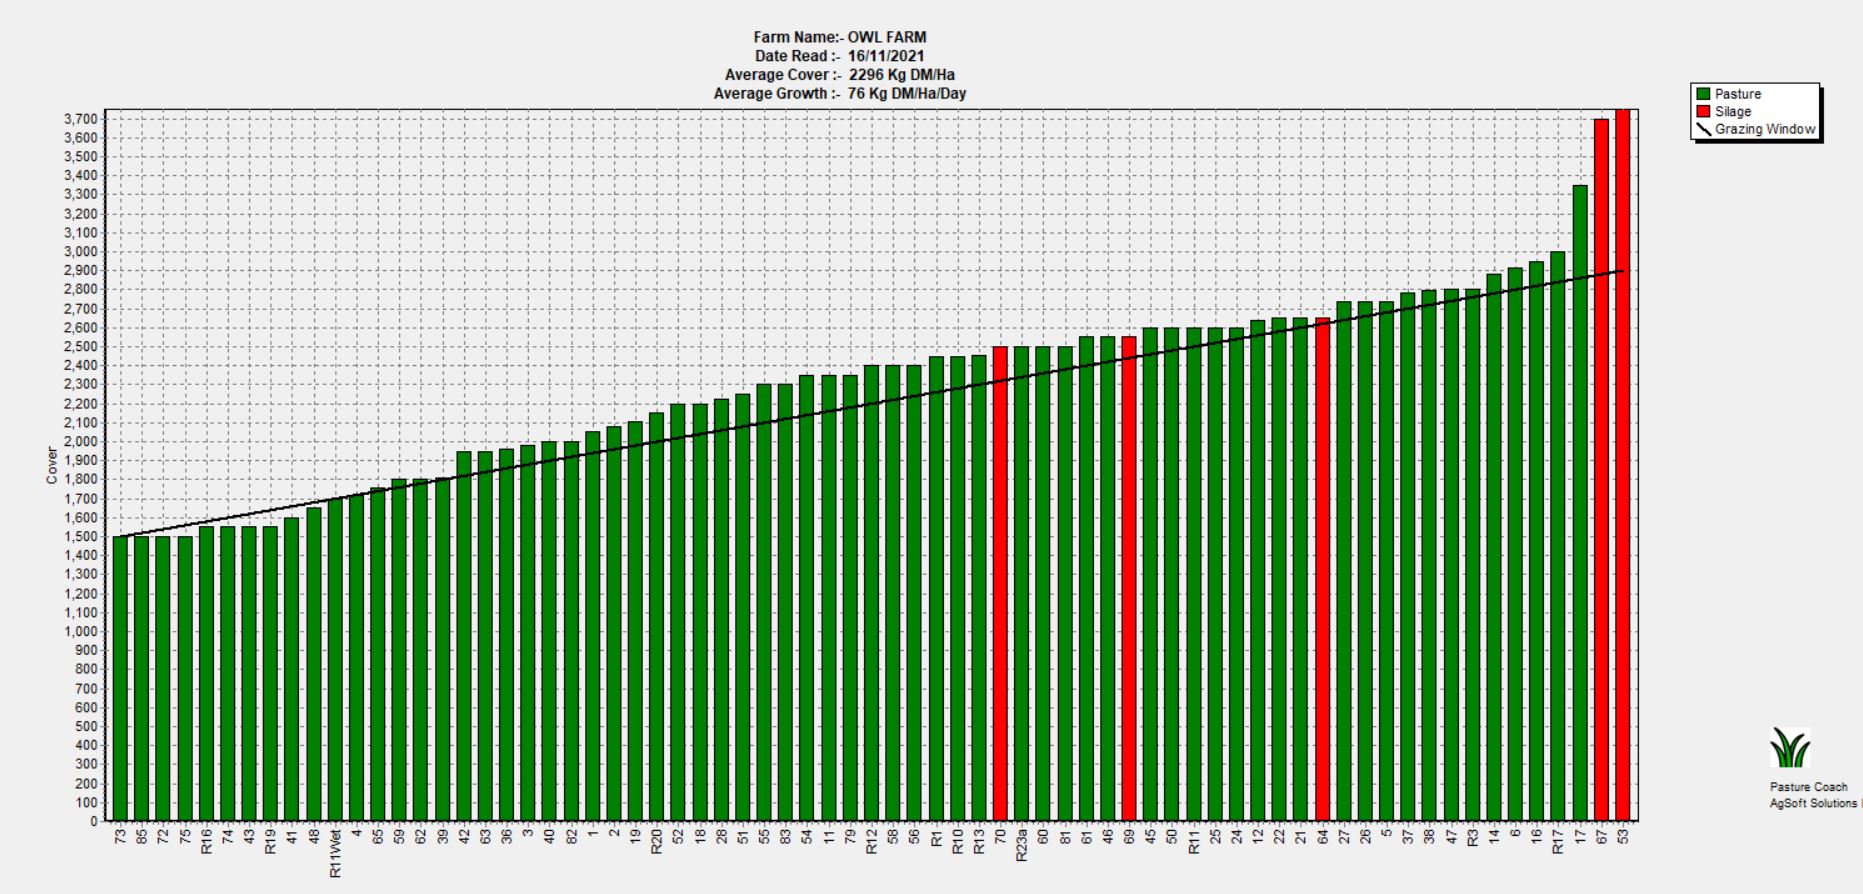
Cover increased to 2296 kg DM/ha with 75 kg DM/ha daily growth rate. Cows are still being offered 20 kg DM with a target pre-graze cover of 2800-2900 kg DM/ha but are leaving variable residuals based on weather and paddock selection. The cows are grazing 6 ha/day (including the area that the 64 weaned calves are now grazing) which is a 22-day rotation.
Milk production continues decline on a similar pattern to last season but tracking a week later. Milk quality excellence is at 97%.
In another 5 weeks we will transition to 3-n-2 milking frequency and start grazing turnips.
With almost 19.8 ha of paddocks previously cut for silage sitting at 2200-2400 kg DM we are selecting paddocks in the middle and top end of the wedge (shown in red), approximately 8.5ha to be cut for silage. While we will trade off yield in some paddocks it allows the cows to graze the silage regrowth paddocks quicker. With recent wet weather there is slight lag on getting silage contractors so we expect to cut in 7-10 days.
With 599 mm of rain season to date we have had 177mm more than last year. This has been favourable for good crop establishment with canopy closure of turnips now after weed and insect spray. After checking the efficacy of the weed spray, we can sit back and watch them grow - just keeping one eye on insect pressure weekly.
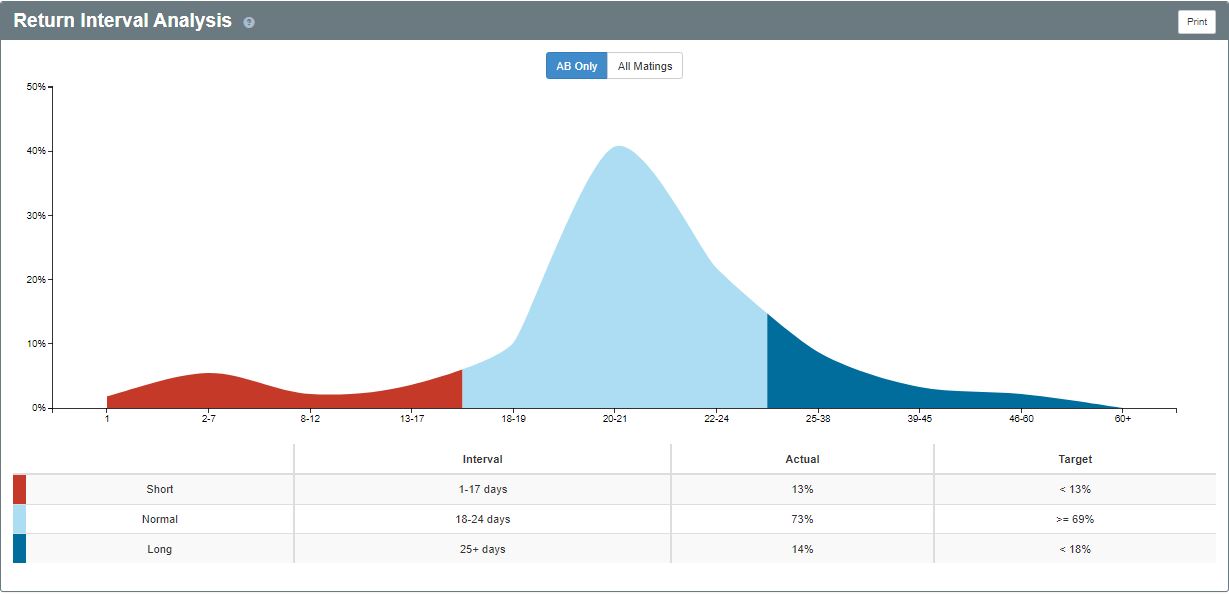
Wednesday marks week 8 of mating. Return Interval analysis from MINDA shows that our portion of short (13%) and long (14%) returns are within the target range. Non-Return Rate is sitting at 51% compared to 50% last season. This provides feedback to the team that heat detection is working well and encourages them to keep up the good work for another 4½ weeks.
ANIMAL WELL-BEING
MgO dusting has finished with cows receiving increased MgCl through the Dosatron. We are increasing from 1.5 bags to 2 bags/day as cows increase water intake, and continue to add aniseed flavouring to maintain palatability at higher concentrations. This will deliver 16 g magnesium/cow/day.
Water leaks are a constant challenge during the summer, and part of the morning routine is to check the Halo dashboard before you fetch the cows. It zeros out at midnight so should show around 500L used before the cows wake up. If it is higher than this a water leak hunt will become the job for the day, starting with yesterday’s paddocks grazed.
Cows are drinking between 60L (on wet days) and up to 110L/day. Last week with 24°C days, cows increased water intake by approximately 25L/cow. This highlights the importance of water availability as temperature and humidity increase. We look out for increases in breathing rates. Less than 7 breaths in 10 seconds is normal. Any more than that and cows are dealing with excess heat. We have not needed to use sprinklers yet. See DairyNZ to prepare your farm with management strategies https://www.dairynz.co.nz/animal/cow-health/heat-stress/
Quick reaction from the team noticing mastitis clots on the sock and then stripping the herd allows early identification of mastitic cows, which has reduced potential spread and maintained our low mastitis rates this season: 16 cows treated season to date (compared to 37 cows in 2020-21).
However, lameness cases have increased over the last 6 weeks during mating with 50 cows drafted out season to date and 8 requiring antibiotic treatment. Part of this increase in drafted cows is a lower tolerance for any sign of lameness. We are refocusing our efforts on removing stones from the yard, hosing the underpass, drafting early and picking up feet, and resting cows in the hospital mob. We have set up the GoPro again to explore animal behaviour in the yard and are working through our planned $20k of race maintenance.
With multiple users on our farm tracks we are seeing exposed stones on areas where we had implemented a short-term fix 18 months ago. You can watch us share our journey dealing with lameness https://youtu.be/2xGv1qcU8ZM
BUSINESS HEALTH
The top 20% Operating Profit benchmark is now available in DairyBase for the North Island and a top 50% for the Waikato region. We encourage you to get your results onto DairyBase as only a few more farms are needed before we can generate a Waikato top 20%. Having other farms to compare against allows us to continually learn and improve our financial performance as we create a sustainable future.
ENVIRONMENT
Students have been busy planting up the 1000 native seedlings from Trees for Survival. These spend the summer in the Ag/Hort shade house with the sprinkler set up on a daily timer ready for planting out in the winter.
Our Farm Insight Report can be found on the website https://www.owlfarm.nz/Content/upload/Documents/Nitrogen_Management_Letters_2020-2021_72847_Party_51324.pdf
It includes lots of information about performance against the co-operative difference framework, nitrogen risks, milking efficiency, lameness, mastitis and heat stress using supplier benchmark data.
DairyNZ is hosting events to help you understand the report or you can talk to your local Fonterra Area Manager to get the most from it.
QUALITY WORKPLACE
The team is motivated to get off the farm to catch up with friends and family again after 6 weeks of lock down. They have been busy planning extended leave on weekends off to suit their family and recreational needs. Hours worked this week was 174 between the team, with our season to date average sitting at 51 hrs/person/week.
COMMUNITY
Nothing to report this week.
PLANNING FOR THE MONTH AHEAD:
Cheers from Jo + Tom

| Milk Production - Week ending | 11/10/2021 | 18/10/2021 | 25/10/2021 | 1/11/2021 | 8/11/2021 | 15/11/2021 | Variance |
|---|---|---|---|---|---|---|---|
| Cow's in milk | 410 | 410 | 409 | 408 | 408 | 407 | - |
| Springer herd/dry cows | 0 | 0 | 0 | 0 | 0 | 0 | - |
| Number of cows in big herd | 250 | 245 | 245 | 245 | 245 | 245 | +5 |
| Number of cows in small herd | 151 | 156 | 156 | 155 | 155 | 154 | -3 |
| Number of cows in colostrum herd | 0 | 0 | 0 | 0 | 0 | 0 | - |
| Number of Cows in the Treatment/Sick herd | 9 | 9 | 8 | 8 | 8 | 8 | +1 |
| KgMS/cow/day (cows in the vat only) | 2.06 | 1.99 | 2.01 | 1.96 | 1.84 | 1.73 | +.03 |
| KgMS/cow YTD | 149.00 | 164.00 | 178.00 | 191.00 | 204.00 | 217.00 | -8 |
| Milk production for week ending (kgMS) | 5900.00 | 5710.00 | 5714.00 | 5584.00 | 5265.00 | 4942.00 | +1487 |
| Total milk production - YTD (kgMS) | 60533.00 | 66246.00 | 71960.00 | 77544.00 | 82809.00 | 87736.00 | -3455 |
| Milk production per ha (kgMS/ha/day) | 5.90 | 5.70 | 5.70 | 5.50 | 5.20 | 4.90 | +.1 |
| Total milk production per ha - YTD (kgMS/ha/YTD) | 420.00 | 460.00 | 500.00 | 539.00 | 575.00 | 609.00 | -24 |
| Protein/Fat ratio | 0.77 | 0.77 | 0.78 | 0.78 | 0.76 | 0.76 | -.01 |
| Bulk Milk SCC (SCC x 1000) | 78 | 79 | 76 | 86 | 89 | 86 | -3 |
| Animal Health - Week ending | 11/10/2021 | 18/10/2021 | 25/10/2021 | 1/11/2021 | 8/11/2021 | 15/11/2021 | Variance |
|---|---|---|---|---|---|---|---|
| BCS (average whole herd) | 4.60 | 4.60 | 4.60 | 4.60 | 4.50 | 4.50 | - |
| BCS (average heifers) | 4.80 | 4.80 | 4.80 | 4.80 | 4.60 | 4.60 | - |
| Treatment/sick herd | 9 | 9 | 8 | 8 | 8 | 8 | 1 |
| Lame cows - new cases | 3 | 2 | 3 | 4 | 8 | 5 | +3 |
| Lame cows - YTD | 28 | 30 | 33 | 37 | 45 | 50 | -2 |
| Mastitis - new cases | 0 | 2 | 0 | 2 | 1 | 0 | - |
| Mastitis - YTD | 11 | 13 | 13 | 15 | 16 | 16 | - |
| Number of cows on penicillin | 0 | 3 | 1 | 2 | 2 | 1 | +1 |
| Number of cows on penicillin YTD | 20 | 23 | 24 | 26 | 28 | 29 | - |
| Culls - new cases | 0 | 0 | 0 | 0 | 0 | 1 | +1 |
| Culls - YTD | 7 | 7 | 7 | 7 | 7 | 8 | - |
| Deaths - new cases | 0 | 1 | 1 | 0 | 0 | 0 | - |
| Deaths - YTD | 0 | 1 | 2 | 2 | 2 | 2 | - |
| Pasture Production - Week ending | 11/10/2021 | 18/10/2021 | 25/10/2021 | 1/11/2021 | 8/11/2021 | 15/11/2021 | Variance |
|---|---|---|---|---|---|---|---|
| Average pasture cover (kgDM/ha) | 2387 | 2301 | 2287 | 2182 | 2167 | 2296 | +108 |
| Average pasture growth rates (kgDM/day) | 79 | 65 | 65 | 96 | 82 | 75 | +2 |
| Lowest post graze residual (kgDM/ha) | 1500 | 1500 | 1500 | 1500 | 1500 | 1500 | - |
| Highest pre graze cover (kgDM/ha) | 3250 | 3350 | 3400 | 3550 | 3550 | 3150 | - |
| Average area grazed/day for milkers (ha) | 5.10 | 5.70 | 5.40 | 5.70 | 6.30 | 6.00 | +.1 |
| Round length | 26 | 23 | 24 | 23 | 21 | 22 | - |
| Total Biomass Measured (kgDM) ) |
| Supplementary Use - Week ending | 11/10/2021 | 18/10/2021 | 25/10/2021 | 1/11/2021 | 8/11/2021 | 15/11/2021 | Variance |
|---|---|---|---|---|---|---|---|
| Average PKE (kg/cow/day) | 0.00 | 0.00 | 0.00 | 0.00 | 0.00 | 0.00 | - |
| PKE YTD | 76.30 | 76.30 | 76.30 | 76.30 | 76.30 | 76.30 | - |
| Average maize (kg/cow/day) | 0.00 | 0.00 | 0.00 | 0.00 | 0.00 | 0.00 | - |
| Maize YTD | 0.00 | 0.00 | 0.00 | 0.00 | 0.00 | 0.00 | - |
| Average silage (kg/cow/day) | 0.00 | 0.00 | 0.00 | 0.00 | 0.00 | 0.00 | - |
| Silage usage YTD | 34.20 | 34.20 | 34.20 | 34.20 | 34.20 | 34.20 | - |
| Silage Harvested Tonnes (DM) | 0.00 | 0.00 | 0.00 | 49.50 | 0.00 | 0.00 | -15 |
| Total Supplement Feed (per cow kgDM) | 0.00 | 0.00 | 0.00 | 0.00 | 0.00 | 0.00 | - |
| Total Supplement YTD (Tonnes) | 119.90 | 119.90 | 119.90 | 119.90 | 119.90 | 119.90 | - |
| Nitrogen and Gibberellic Acid - Week ending | 11/10/2021 | 18/10/2021 | 25/10/2021 | 1/11/2021 | 8/11/2021 | 15/11/2021 | Variance |
|---|---|---|---|---|---|---|---|
| kgN applied per ha/% of farm | 23.00 KgN/ 20.80 % | 0.00 KgN/ 0.00 % | 0.00 KgN/ 0.00 % | 25.00 KgN/ 38.20 % | 23.50 KgN/ 26.40 % | 23.00 KgN/ 17.40 % | 17.40 % |
| kgN applied YTD (average kgN/ha) | 60.90 | 60.90 | 60.90 | 70.40 | 75.80 | 79.80 | - |
| GA applied (20gm/ha) | 0.00 | 0.00 | 0.00 | 0.00 | 0.00 | 0.00 | - |
| Effluent applied | |||||||
| Effluent Applied y/n | Y | Y | Y | N | N | Y | - |
| Paddocks effluent applied | 1 | 1 | 3 | 0 | 0 | 4 | -1 |
| Application Depth (mm) | 18.00 | 18.00 | 18.00 | 0.00 | 0.00 | 18.00 | - |
| Climate - Week ending | 11/10/2021 | 18/10/2021 | 25/10/2021 | 1/11/2021 | 8/11/2021 | 15/11/2021 | Variance |
|---|---|---|---|---|---|---|---|
| Temperature (ave. °C) | 14.80 | 11.10 | 15.34 | 17.00 | 18.00 | 20.00 | +2.98 |
| Rainfall | 15.00 | 21.20 | 14.00 | 42.00 | 14.50 | 35.00 | +31 |
| Rainfall Season-to-Date | 506.20 | 527.40 | 541.40 | 583.40 | 597.90 | 632.90 | -4 |
| Soil temperature (ave. °C at 10cm depth) | 15.80 | 15.20 | 15.80 | 18.50 | 18.00 | 20.00 | - |
| Soil Moisture(% at 10cm depth) | 33.20 | 33.20 | 32.70 | 33.80 | 33.10 | 33.50 | +.8 |
 Home
Home  OwlFarm Home
 News
News  Images
 Videos
 Milk Production
 Animal Health
 Pasture Production
 Supplementary Use
 Nitrogen & Gibberellic Acid Use
 Climate
 Ops Manual
  Financials
  Health